Productivity Analytics: Metrics Are Mission Critical
When every second on the packing line translates to dollars out of your bottom line, having the right metric isn’t just nice-to-have — it’s mission critical. Traditional KPIs like orders per hour (OPH) only tell you how fast the line is moving; they don’t explain why it slows down, or where precious minutes disappear.
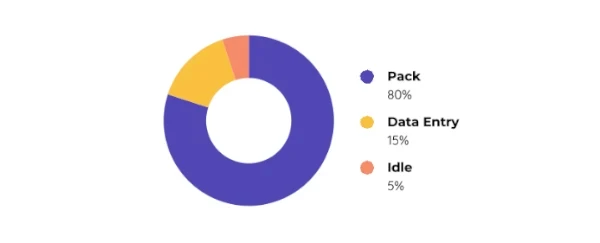
That’s exactly the gap Rabot set out to close with our new Productivity Analytics feature, powered by the Activity Profile — our affectionately nick-named “donut.”
From data overload to actionable insight
Rabot’s cameras and sensors automatically capture every motion at the packing station, transforming raw video into a simple, three-color Activity Profile:
| Segment | What It Captures | Typical Activities |
|---|---|---|
| Pack (Purple) | Hands-on, value-adding tasks | Building boxes, placing items, taping, labeling |
| Data Entry (Gold) | Interactions with digital tools | Keying orders, scanning barcodes, printing labels |
| Idle (Coral) | Non-productive or waiting time | Looking for materials, waiting on a supervisor, walking away |
What “good” looks like (and how to get there)
Through millions of packed items across high-growth 3PLs, we’ve observed an optimal mix of roughly 80% Pack, 15% Data Entry, 5% Idle. Stations that achieve this balance share three common traits:
- Ergonomic layouts — Everything the operator needs is within an easy arm’s reach.
- Seamless tech — WMS interactions are automated or consolidated into a single scan.
- Real-time support — Issues are surfaced instantly, so operators aren’t left waiting.
Two real-world examples
Example #1 — Data entry off the charts
A 3PL discovered that 44% of an operator’s time was swallowed by repetitive WMS clicks. By integrating Rabot’s one-scan automation, they slashed Data Entry to 14% and boosted throughput 12% overnight.
Example #2 — Idle time = Call for Help
Another customer saw 28% Idle because packers were constantly walking to fetch dunnage. Using Rabot’s Digital Andon, operators can now summon replenishment with one tap — cutting Idle in half and raising station performance to 64/100.
The payoff
- 50M+ items processed through Rabot vision
- 33% productivity lift at benchmark sites
- 66% reduction in QA & support costs
Every donut tells a story. What will yours reveal?
Ready to see your activity profile?
Book a demo and start turning hidden factory waste into measurable wins.
Your mileage may vary. Percentages shown are illustrative, not an industry standard.
Try it now — Book a demo to see this feature in action.