5 Essential Warehouse KPIs and How to Track Them
You cannot improve what you do not measure. It is an old line for a reason. But plenty of warehouses measure the wrong things, measure them inconsistently, or collect data that never turns into action. The result is the same either way: inefficiencies hide, costs drift up, and customer satisfaction erodes quietly.
The good news is you do not need a dashboard with thirty metrics. Five KPIs, tracked consistently and acted on deliberately, will do more for your operation than a reporting suite nobody opens. Here are the five we come back to most often, how to calculate each, and how to build a system that actually drives improvement.
KPI #1: Order accuracy rate
What it is: the percentage of orders shipped correctly. Right items, right quantities, right address, right paperwork.
How to calculate it:
Order Accuracy Rate = (Correct Orders / Total Orders Shipped) x 100
Industry benchmarks: most warehouses live between 97% and 99%. Anything at 99.5% or higher is world-class. Those numbers look close together on paper, but the gap gets wide at volume. A warehouse shipping 5,000 orders a day at 97% is putting out 150 wrong orders every day. Each one is a potential return, a customer service ticket, and a chip off your brand.
Where the errors usually come from:
- Mispicks (wrong SKU, wrong quantity)
- Packing errors (items in the wrong box, missing accessories)
- Labeling mistakes (right items, wrong address)
- Inventory discrepancies that force substitutions or short-ships
How to improve it:
- Scan verification at every stage. Barcode or RFID, at pick and at pack.
- Pick-to-light or voice-directed picking to cut human error
- Root cause analysis on every error, not just random audits
- Video verification at pack stations. Solutions like Rabot’s Vision AI give you a visual record of every order, so you can find out where and when an error happened instead of waiting on the customer complaint. This is one checkpoint in a broader stage-by-stage QC system.
Track this one daily and review the trend weekly. Even a small dip, say 99.2% to 98.8%, is worth investigating the same day.
KPI #2: Order cycle time
What it is: how long an order takes from the moment it is received (or released to the floor) to the moment it ships. This is the one your customers feel directly, because it is what determines how fast their box shows up.
How to calculate it:
Order Cycle Time = Shipment Date/Time - Order Receipt Date/Time
You want to split this into pieces to make it useful:
- Pick time, from release to pick complete
- Pack time, from pick complete to pack complete
- Staging/ship time, from pack complete to carrier handoff
Where it slows down:
- Picking is usually the longest segment, especially in big buildings with bad slotting or congested aisles.
- Packing slows when stations run out of materials, when orders need kitting or inserts, or when packers are waiting on QC.
- Staging delays are often carrier cutoff problems or a disorganized dock.
How to pull time out:
- Slot high-velocity SKUs closer to pack
- Batch similar orders to cut travel per pick
- Pre-stage packing materials so packers never wait on supplies
- Set real cutoff times with buffer, so orders are not rushed at the end of the shift
- Measure each segment separately. You cannot fix a bottleneck you cannot see.
For a well-run ecom warehouse, 2 to 4 hours from release to shipment is a reasonable target for standard orders. It varies by size and complexity.
KPI #3: Inventory accuracy
What it is: how closely your system count matches what is actually on the shelf. Bad inventory accuracy is upstream of a lot of other problems: mispicks, stockouts, overselling, wasted labor hunting for product.
How to calculate it:
Inventory Accuracy = (Accurate SKU Counts / Total SKU Counts Audited) x 100
Target: 99% or higher is the standard for well-managed operations. Anything under 95% is a serious process problem.
Perpetual vs. periodic:
- Periodic (full physical inventory) is disruptive and usually happens once or twice a year. It gives you a snapshot but misses problems in real time.
- Perpetual updates counts with every transaction. More accurate day to day, but still needs validation.
Cycle counting tips:
- Count a slice every day instead of everything once a year.
- Prioritize by ABC. A items weekly or biweekly, B items monthly, C items quarterly.
- Investigate every discrepancy, not just the big ones. Small variances usually mean a systemic issue, like a receiving step or a bad bin location.
- Count at the start of the shift, before the day’s transactions add noise.
The cost of getting this wrong compounds. Pickers get sent to empty locations. Orders get promised to customers that cannot be fulfilled. Purchasing makes decisions on bad data. Every point of inaccuracy costs you real time, real sales, and real trust.
KPI #4: Picking productivity
What it is: how efficiently your team is fulfilling orders at the pick stage. Picking is usually 50% or more of total warehouse labor cost, so even small gains here show up on the bottom line.
How to calculate it:
Picking Productivity = Lines (or Units) Picked / Labor Hours Spent Picking
You can do this in lines per hour or units per hour. Lines per hour is generally more useful, because it accounts for the travel and transaction overhead of each pick, regardless of how many units are in it.
Benchmarks, very roughly:
- Single-order picking: 60-80 lines/hour
- Batch picking: 100-150 lines/hour
- Zone picking with conveyor: 150-250+ lines/hour
What moves the needle:
- Layout and slotting. Are your fast movers in the easy spots?
- Pick method. Single, batch, zone, wave?
- Technology. Paper vs. RF scanner vs. voice vs. pick-to-light.
- Travel distance. The single biggest time sink in most pick operations.
- Congestion. Too many pickers fighting for the same aisle.
What to try:
- Re-slot on current velocity, not last quarter’s numbers.
- Move from single-order picking to batch or zone where order profiles support it.
- Cut travel by clustering pick faces and sequencing pick paths.
- Track productivity by individual. Use it for training, not surveillance, and to recognize the people doing it well. Continuous, ambient measurement also sidesteps the Hawthorne effect, where operators speed up only while a supervisor is timing them.
- Cut unnecessary steps. Redundant scans, manual paperwork, anything that is not adding value.
KPI #5: Return rate and damage rate
What it is: the percentage of orders that come back or get reported damaged, specifically isolating the ones caused by warehouse-attributable errors rather than customer preference or product defects.
How to calculate:
Warehouse-Attributable Return Rate = (Returns from Warehouse Errors / Total Orders Shipped) x 100
Damage Rate = (Orders Reported Damaged / Total Orders Shipped) x 100
Why it matters: returns are expensive. Industry estimates put the cost of processing a single return at $10 to $20 or more once you factor in shipping, inspection, restocking, and product loss. When a return is caused by a packing error, that cost is 100% preventable.
How to use it:
- Categorize every return by root cause. Wrong item, missing item, damaged in transit, customer preference, defective product.
- Separate warehouse-caused returns from product or customer returns. Your team is accountable for the things they can control, not the things they cannot.
- Tie packing quality to return rate. Which stations, shifts, or SKUs are generating the errors?
- Run root cause analysis on damage claims. Is it packaging material, technique, or carrier handling?
Benchmark: world-class operations keep warehouse-attributable returns below 1%. Above 2% means there is real money on the table in picking and packing.
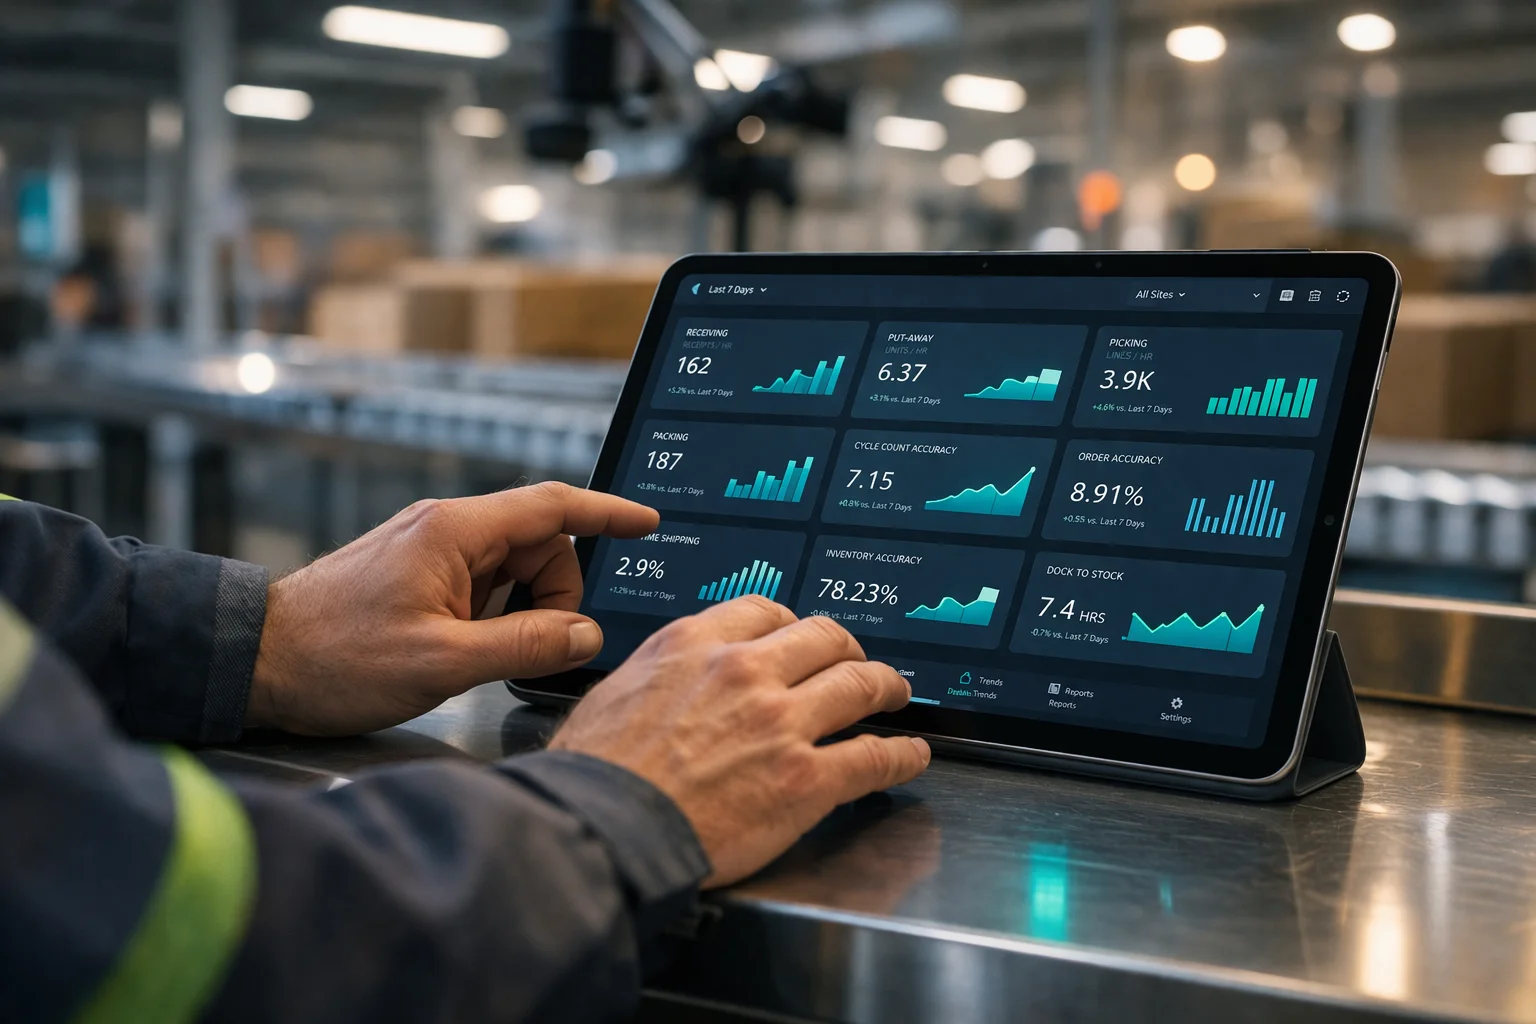
Build a dashboard people actually look at
Data only matters if it reaches the right people at the right time. Here is how to make that happen.
Sources you will need:
- WMS for order, inventory, and labor data
- TMS for shipment and delivery data
- Returns system for return reason codes
- Quality and verification tools for packing accuracy data
How often to update:
- Real-time or hourly: picking productivity, cycle time, so supervisors can actually intervene during a shift
- Daily: order accuracy, orders shipped, cycle time averages
- Weekly: inventory accuracy, return rate trends, overall KPI trend lines
- Monthly: deep dives with root cause analysis and improvement plans
Where to put the data:
- Floor displays. Big monitors on the warehouse floor showing real-time productivity and accuracy. When the team can see how they are doing, motivation and accountability both go up.
- Supervisor dashboards. Shift-level detail with the ability to drill into individuals and stations.
- Management dashboards. Trend lines, cost impact, progress against targets.
Triggers that require a response:
- Order accuracy drops below 99% → same-day investigation
- Cycle time runs 20%+ over target → supervisor escalation
- Inventory accuracy falls below 98% → targeted cycle count
- Any KPI trends down three days in a row → root cause review
From data to decisions
A dashboard full of numbers means nothing without a system to act on them. A practical framework:
-
Get a baseline first. Before setting targets, measure your current state for at least 30 days. You want to understand both the level and the natural variation before you start moving.
-
Set targets you can actually hit. If order accuracy is at 98.5%, aim for 99.0% first, not 99.9%. Unrealistic goals get ignored.
-
Run PDCA cycles as part of a broader continuous improvement discipline. Plan the intervention, do it on a small scale, check the result, act on what you learned. Keep the loop short.
-
Review weekly. A short KPI review with shift leads. What improved, what declined, what is the one thing we are working on this week?
-
Celebrate wins visibly. When the team hits a number, call it out. Post the result. Name the people and shifts that made it happen. Improvement is sustained by momentum.
-
Tie KPIs back to business outcomes. A 1% bump in accuracy is not just fewer mistakes. It is fewer returns, lower cost, happier customers, more repeat business. Make the connection clear.
Getting started
You do not need all five on day one. Start with the one or two that hit your biggest pain point. If customer complaints about wrong items are your problem, start with accuracy and return rate. If throughput is the issue, start with cycle time and picking productivity.
Consistency is what matters. A simple metric measured reliably every day beats a sophisticated dashboard updated when someone remembers.
If you want tools to get objective data on packing quality and a foundation for these KPIs, get in touch with the Rabot team to see how Vision AI can give you the clarity to run continuous improvement with confidence.